The intensity of trade exchange between these three economic poles is determined by many factors — from markets to infrastructure, such as transport and logistics potential and the capacity of existing routes. These links are grounded in the search for an optimal balance of geographic, political and economic factors. In addition, their long-term institutional interaction, supported by a wide range of bilateral international agreements, is also decisive. Characteristically, the two most sweeping treaties for interaction, namely the Comprehensive Investment Agreement (between the EU and China) and the Transatlantic Trade and Investment Partnership (between the EU and the USA), reached their final stages of development, but at the last stage they never entered into force.
We can speak, at present, about the significant intensity of trade and economic relations between Europe and its partners in the West and the Far East. In 2021, the total exports of EU countries to the United States amounted to almost 400 billion euros, while exports to China totaled 223.4 billion euros. By weight, the exports measured 73.8 million tons and 51.6 million tons, respectively.
The EU’s trade with each of these partners has specific features. EU exports to the US and China have a different structure. The key components of trade with the United States are fuel and energy (35% of the volume) and agriculture (11%). The key components in trade cooperation with China are forestry industry products (39%), agriculture, and the food industry (25%).
At the same time, in terms of value, products with a high degree of processing are in the lead (for example, pharmaceutical products, vehicles and components, electronics, etc.). It should also be noted that there are country differences in the volume of exports to the US and China.
Despite accounting for a significant proportion of the physical traffic of EU exports to the United States, mineral fuels and raw materials account for no more than 3% of all exports in terms of value. This is due to high-value goods in the range of exports, primarily from the chemical and engineering industries. European medicines, medical products, cars and auto parts are much more expensive than raw materials and oil products per unit weight. EU exports to China are also replete with highly processed goods, which explains the dominance in the structure of value exports of engineering industry products: cars and auto parts, electronics, aircraft, and various types of equipment. The existing proportions of trade flows are reflected in the structures of exports by mode of transport, by which goods leave the EU countries.
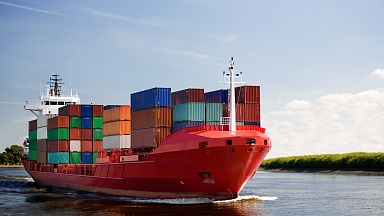
Eurostat data indicate that the bulk of the cargo flow is transported by sea, while air transit accounts for the lion’s share of exports in terms of cost and processing. It is noteworthy that the structure of EU exports to the US and China by mode of transport, both in physical and value terms, are quite similar: in physical terms, the share of maritime transport in exports to both the US and China is about 95%, and in value terms, 52%. The share of land transport is small in both cases: in value terms, rail accounts for no more than 6% of EU exports to China, and road transport accounts for 2%. In physical terms, the figures are 2% and 1%, respectively. The presence of insignificant volumes of overland exports from the EU to the USA can be explained by the fact that the statistics reflect only the first mode of transport in the supply chain; that is, the mode by which the goods leave the territory of the exporting EU country.
Thus, this review is intended to reveal the nature of European exports and uncover what impact the growing volume of EU exports to the US have had on EU exports to China, and whether there is competition between these destinations for European exports.


